Creating Custom Borders for Widgets and Layouts in PSLab Android

User Interface (UI) is one of the most important part of any software development. In PSLab Android App while developing the UI, custom borders are used for various widgets and layouts. This makes the UI look more appealing and widgets and layouts look more highlighted.

In Android, we can do a range of border customization. We can make border rounded, define its thickness and even change its color. Let’s see how to achieve this.

First, go to drawable folder in the tree view on the left size of the Android studio. Then go to new and click on Drawable resource file.

Then a New Resource File dialog box will appear. Type the filename and then click OK.

After this, a new XML file is created. Now we can write the code for creating custom borders. For this, we have to define few elements.

<?xml version="1.0" encoding="UTF-8"?>
<shape xmlns:android="http://schemas.android.com/apk/res/android">
....
</shape>

Shape Drawables allows defining background, borders, and gradients for the Views.

<solid android:color="#FFFFFF"/>

Here we are setting the background color of the widget/layout to which the border is applied to.

<stroke android:width="3dip" android:color="#B1BCBE" />

Now we are applying the 3dip width to the border and set its color. This shape requires the <stroke> element to define the width and color of the line.

<corners android:radius="10dip"/>

In order to make the corners of the border round, <corner> element is used to define the radius of the corners. We are taking it to be 10dip.

<padding android:left="0dip" android:top="0dip" android:right="0dip" android:bottom="0dip" />

The padding is expressed in pixels for the left, top, right and bottom parts of the view. Padding is used to offset the content of the view by a specific number of pixels.

After applying this border on a layout we get the following results.

Similarly making following changes in the element values help us to make border for the Text View

<solid android:color="@android:color/white" />
<stroke android:width="1dip" android:color="#ffcdd2" />
<corners android:radius="2dp"/>

Other examples

Control Activity

Logical Analyzer Activity

Resources

  1. Stack Overflow Solution to How to make a layout with rounded corners?
  2. Youtube Video on How to create a layout with rounded corner borders in Android? by Sylvain Saurel
Continue ReadingCreating Custom Borders for Widgets and Layouts in PSLab Android

Performing Multivibrator Experiments in PSLab Android App

A Multivibrator is an Oscillator that produces non-sinusoidal signals like Square Wave. Multivibrators are considered to be the building blocks of almost every electronic device.

Multivibrators are the level changing circuit. Every circuit works on two level, “high” and “low”. Multivibrators changes between these two level to produce a particular voltage form.

PSLab Android App helps us to observe the input and the output signals captured from these circuits. This enables student or researchers to study the input and output waveforms. Let’s discuss various Multivibrator Experiments that can be conducted using PSLab and how they are implemented.


There are three types of multivibrator:

  1. Astable multivibrator
  2. Bistable multivibrator
  3. Monostable multivibrator

Astable Multivibrator


An astable-multivibrator circuit’s output oscillates continuously between its two unstable states. It is a cross-coupled transistor switching circuit. They are also known as Free Multivibrator as any additional inputs or external assistance to oscillate are not required by them. Astable oscillators produce a continuous square wave from its output

Astable are used as clocks and timers, bistable as flip flops, the memory, registers and counters, Schmitt triggers as memory, switches, wave shapers.

The following is the circuit diagram.

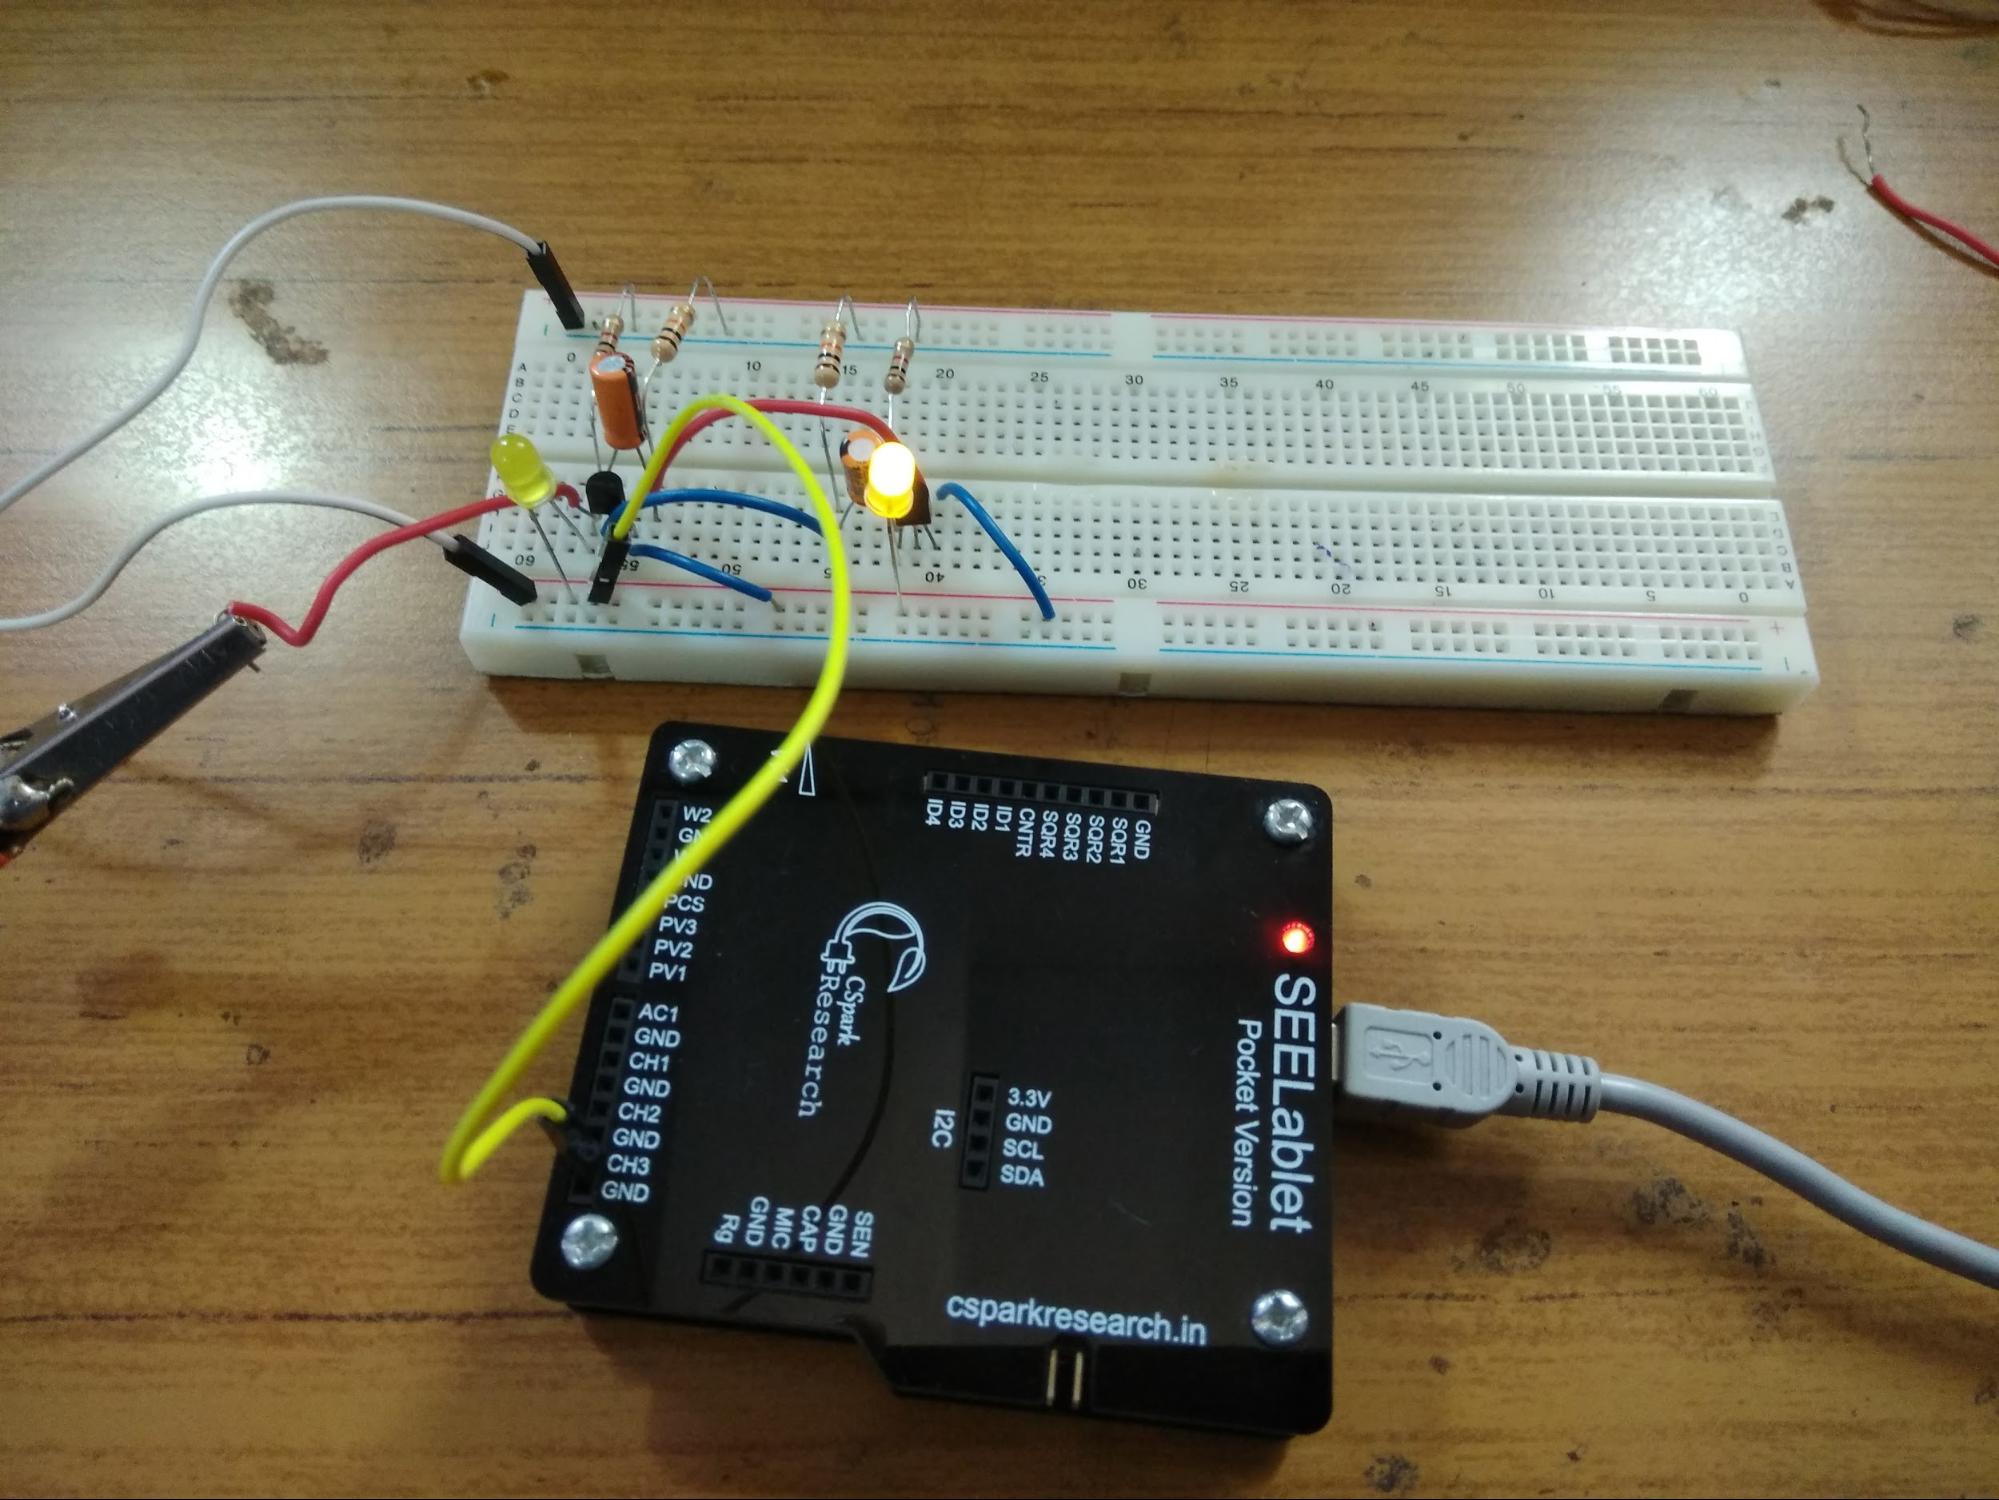
In order to observe the behaviour of Astable Multivibrator, LED’s can be also used.

We get the following waveform when captured using the PSLab device.

Monostable Multivibrator

Monostable is also known as one shot multivibrator. In monostable multivibrator, there is one stable state and one astable state. A trigger pulse is required to enter into the astable state or get back to the stable state. The monostable multivibrator is mainly used as a timer.

The following is the schematics of Monostable Multivibrator

Image link – https://circuitdigest.com/electronic-circuits/555-timer-monostable-circuit-diagram

Following signals are captured by the device while conducting the experiment.

Adding Multivibrator Experiment support in PSLab Android

This was simply achieved by reusing Oscilloscope Activity. Oscilloscope Activity is informed about the experiment by using putExtra() and getExtra() methods and Oscilloscope simply aligns its layout according to it.

Analysing Frequencies

In order to analyse the frequencies of the waves captured, we used sine fitting. Sine fitting function simply takes the data points and returns the amplitude, frequency, offset and phase shift of the wave.

Resources

Continue ReadingPerforming Multivibrator Experiments in PSLab Android App

Performing Oscillator Experiments with PSLab

Using PSLab we can read the waveform generated by different Oscillators. First, let’s discuss what’s an Oscillator? An Oscillator is an electronic circuit that converts unidirectional current flow from a DC source into an alternating waveform. Oscillators can produce a sine wave, triangular wave or square wave. Oscillators are used in computers, clocks, watches, radios, and metal detectors. In this post, we are going to discuss 3 different types of Oscillators.

  • Colpitts Oscillator
  • Phase Shift Oscillator
  • Wien Bridge Oscillator

Colpitts Oscillator

The Colpitts oscillator produces sinusoidal oscillations. The Colpitts oscillator has a tank circuit which consists of two capacitors in series and an inductor connected in parallel to the serial combination. The two capacitors in series produce a 180o phase shift which is inverted by another 180o to produce the required positive feedback. The frequency of the oscillations is determined by the value of the capacitors and inductor in the tank circuit.

Image source

Image source

Phase Shift Oscillator

A phase-shift oscillator produces a sine wave output using regenerative feedback obtained from the combination of resistor and capacitor. This regenerative feedback from the RC network is due to the ability of the capacitor to store an electric charge.

Image source

Wien bridge oscillator

A Wien bridge oscillator generates sine waves. It can generate a large range of frequencies and is based on a bridge circuit. It employs two transistors, each producing a phase shift of 180°, and thus producing a total phase-shift of 360° or 0°. It is simple in design, compact in size, and stable in its frequency output.


Image source

Mapping output waves from the Oscillator Circuits in PSLab Android app

To make PSLab Android app to support experiments related to read the waveforms received from the Oscillator we reused Oscilloscope Activity. In order to analyze the frequencies of the waves captured, we used sine fitting. Sine fitting function simply takes the data points and returns the amplitude, frequency, offset and phase shift of the wave.

The following is a glimpse of output signals from the Oscillators being captured by PSLab Android.

Resources

Read more on Oscillator from the following links

Continue ReadingPerforming Oscillator Experiments with PSLab

Performing Diode Clipping and Clamping Experiment in PSLab Android

We can perform experiments like diode clipping and clamping using PSLab Android. A circuit which removes the peak of a waveform is known as a clipper. Diode clipper cuts off the top half or lower half or both top and lower half of the input signal. 

Different types of clipping circuits listed below

Different Clipping Experiments

A clamper circuit adds the positive dc component to the input signal to push it to the positive side. Similarly, a clamper circuit adds the negative dc component to the input signal to push it to the negative side. It basically shifts the input signal without changing the shape of the signal.

Different Clamping Experiments

Apparatus

Diode, Resistance, Capacitor (only for diode clamping), Breadboard, Wires and PSLab

Adding Diode Clipping Experiment support in PSLab Android App

To support Diode Clipping Experiment we require generating a sine wave and a dc component. This can be done using W1 and PV1 pins in PSLab device. Both input and output signals can be read using CH1 and CH2. So, when the Diode Clipping Experiment needs to be performed the following code needs to be implemented

scienceLab.setSine1(5000);
scienceLab.setPV1(//progress of the seekbar);

The signals are recorded using Oscilloscope Activity.

Adding Diode Clamping Experiment support in PSLab Android App

Diode Clamping Experiment was implemented similarly to Diode Clipping Experiment. The following are the screenshots of the experiment.     

The following is a glimpse of Diode Clamping Experiment performed using PSLab device using PSLab Android App.

Resources

  1. Read more about Clipper Circuits –
  2. Read more information about Clamping Circuits –

Continue ReadingPerforming Diode Clipping and Clamping Experiment in PSLab Android

Providing Support for Performing Rectifier Experiments in PSLab Android

PSLab can be used to perform Half and Full Wave Rectifier Experiments. A rectifier is an electrical device that converts alternating current (AC), which periodically reverses direction, to direct current (DC), which flows in only one direction. Half wave rectifiers clip out the negative part of the input waveform. The rectified signal can be further filtered with a capacitor in order to obtain a low ripple DC voltage. Only a diode is needed to clip out the negative part of the input signal. Full wave rectifiers combine the positive halves of 180 degrees out of phase input waveforms such as those output from AC transformers with a center tap. The rectified signal can be further filtered with a capacitor in order to obtain a low ripple DC voltage. Two diodes are used to clip out the negative parts of both inputs and combine them into a single output which is always in the positive region.

In order to support Half Wave Rectifier Experiments in PSLab, we used Oscilloscope Activity. For Half Rectifier Experiment we require to generate a sine wave from W1 channel and read signals from CH1 and CH2.

To implement this we first need to inform the Oscilloscope Activity whether Half Wave Rectifier Experiment needs to be performed or not. For this, we used putExtra and getExtra methods.

  Bundle extras = getIntent().getExtras();
  if ("Half Rectifier".equals(extras.getString("who"))) {
          isHalfWaveRectifierExperiment = true;        
 }

Then we programmatically change the layout. The side panel is made disappear and the graph and lower panel of the Oscilloscope expands horizontally.

if (isHalfWaveRectifierExperiment) {
            linearLayout.setVisibility(View.INVISIBLE);
            RelativeLayout.LayoutParams lineChartParams = (RelativeLayout.LayoutParams) mChartLayout.getLayoutParams();
            lineChartParams.height = height * 5 / 6;
            lineChartParams.width = width;
            RelativeLayout.LayoutParams frameLayoutParams = (RelativeLayout.LayoutParams) frameLayout.getLayoutParams();
            frameLayoutParams.height = height / 6;
            frameLayoutParams.width = width;
        }

The fragment for lower panel is replaced by the fragment designed for Half Wave Rectifier

halfwaveRectifierFragment = new HalfwaveRectifierFragment();
 
if (isHalfWaveRectifierExperiment) {
addFragment(R.id.layout_dock_os2, halfwaveRectifierFragment, "HalfWaveFragment");
 }

We get the following layout, ready to perform halfwave rectifier experiment.

For making the graph functional, capturing signals from CH1 and CH2 is required. For this, we reused CaptureTwo AsyncTask in such a way that it captures signals from CH1 and CH2 channels where CH1 is the input signal and CH2 is the output signal.

if (scienceLab.isConnected() && isHalfWaveRectifierExperiment) {
   captureTask2 = new CaptureTaskTwo();
   captureTask2.execute("CH1");
   synchronized (lock) {
       try {
           lock.wait();
       } catch (InterruptedException e) {
           e.printStackTrace();
       }
   }
}


By following the above steps we reused Oscilloscope Activity to perform Rectifier Experiments.

Resources

Continue ReadingProviding Support for Performing Rectifier Experiments in PSLab Android

Developing Control Panel for Sensor Activity in PSLab Android

Once we are able to capture data from the sensor using the PSLab device and stimulate it on PSLab Android App, we now require to provide the user various control options. These control options help the user to customize the data captures from the sensors. These options are available for all the sensors.

  • Number of samples: This allows the user to enter the number of samples he/she wants to capture.
  • Indefinite mode: This allows the user to capture indefinite samples from the sensors.
  • Play/Pause: This allows the user to start or pause the capture anytime.
  • Time-gap: User can set the time-gap between each sample capture.

Let’s discuss how to implement these control options in PSLab Android.

Creating layout for Control Panel

Initially, a control panel is created. A separate layout is created for the same in the sensor activity. Inside the layout, we added

  • An Image-Button which works as a play and pause button
  • An Edit-Text in which the user can enter the number of samples to be captured.
  • A Check-Box which enables indefinite sample capture.
  • A Seek-Bar which sets the time-gap between each sample capture.

Adding functionality to widgets.

Image-Button on-click listener has two roles to play. One role is to change the play image to pause image or vice versa and another is to set boolean variable true or false. This variable is used to stop or start the thread which is involved in fetching data from the sensor.

playPauseButton.setOnClickListener(new View.OnClickListener() {
   @Override
   public void onClick(View v) {
       if (play) {
           playPauseButton.setImageResource(R.drawable.play);
           play = false;
       } else {
           playPauseButton.setImageResource(R.drawable.pause);
           play = true;
       }
   }
});

The play variable can be accessed by the different fragment to pause or resume the capture of the data from the sensors.

if (scienceLab.isConnected() && ((SensorActivity) getActivity()).play) {
//rest of the code
}

The number entered in the Edit-Box work as the maximum limit of samples to be captured. For this, a simple counter function is implemented. If the count value reaches the value in Edit-Box the thread is AsyncTask for fetching sensor data is not called any further. Enabling the Check-Box, disables the Edit-Box and hence eliminate the role of counter function resulting in AsyncTask (for fetching sensor data) being called indefinitely.

Time gap Seek-Bar sets the delay between each time AsyncTask for fetching sensor data is called. The thread sleeps for  the time selected in the Seek-Bar before AsyncTask is called again. Here is the code snippet for it.

try {
   Thread.sleep(((SensorActivity) getActivity()).timegap);
} catch (InterruptedException e) {
   e.printStackTrace();
}

This implements control panel for sensor activity in PSLab Android. To follow the entire code, click here.

Resources

Stack Overflow solution on how to change Imagebutton’s image onClick.

Continue ReadingDeveloping Control Panel for Sensor Activity in PSLab Android

Custom SeekBar in PSLab Android

By default Seekbar in Android only return integer values greater than zero. But there can be some situation where we need the SeekBar to return a float and negative values. To implement trigger functionality in the Oscilloscope activity of PSLab Android app, we require a SeekBar that sets a voltage level that should trigger the capture sequence. Since this voltage value ranges between -16.5 V to 16.5 V, default Seekbar don’t serve the purpose.

The solution is to create a custom SeekBar that returns float values. Let’s understand how to implement it.

Create a FloatSeekBar class which extends AppCompatSeekBar. Create a constructor for the class with Context, AttributeSet and defStyle as parameters. AttributeSet is the set of properties specified in an XML resource file whereas defStyle is default style to apply to this view.

public class FloatSeekBar extends android.support.v7.widget.AppCompatSeekBar {
   private double max = 0.0;
   private double min = 0.0;

   public FloatSeekBar(Context context, AttributeSet attrs, int defStyle) {
       super(context, attrs, defStyle);
       applyAttrs(attrs);
   }


Then define setters method which set the max and min values of the SeekBar. This method basically sets the range of the SeekBar.

public void setters(double a, double b)
{
   min = a;
   max = b;
}


getValue is a method that manipulates current progress of the SeekBar and returns the value. Here the equation used to determine the value is (max – min) * (getProgress() / getMax()) + min.

public double getValue() {
   DecimalFormat df = new DecimalFormat("#.##");
   Double value = (max - min) * ((float) getProgress() / (float) getMax()) + min;
   value = Double.valueOf(df.format(value));
   return value;
}


setValue method takes the double value, and accordingly set the progress of the SeekBar.

public void setValue(double value) {
   setProgress((int) ((value - min) / (max - min) * getMax()));
}

This creates a custom SeekBar, it can be used just like a normal SeekBar.

Now, set the range of custom SeekBar between -16.5 and 16.5.

seekBarTrigger = (FloatSeekBar) v.findViewById(R.id.seekBar_trigger);
seekBarTrigger.setters(-16.5, 16.5);


In order to get value of the custom SeekBar call getValue method.

seekBarTrigger.getValue();

In order to follow the entire code for custom SeekBar implementation in PSLab refer FloatSeekBar.java, Attr.xml and TimebaseTrigger.java.

A glimpse of custom SeekBar in PSLab Android.

Resources


Continue ReadingCustom SeekBar in PSLab Android

Comparing Different Graph View Libraries and Integrating Them in PSLab Android Application

There is a significant role of graphs in PSLab, they’re used for the following purpose:

For this, we need to implement real time graphs that stimulate real time data from the PSLab device efficiently. It is necessary to analyze each and every Graph View Library, compare them and integrate the best one in PSLab Android app.

Available Graph Libraries

The available Graph View libraries of Android are:

  1. MPAndroidChart
  2. Graph-View
  3. SciChart

Which one is the best with respect to the PSLab project?

MPAndroidChart

Line Graph plotted using MPAndroidChart (image source)

It is an open source graph view library by Philipp Jahoda. The following are the features of MPAndroidChart

  • There are 8 different chart types
  • Scaling on both axes. Scaling can be done using pinch zoom gesture.
  • Dual Axes, we can have 2 Y-axis.
  • Real time support
  • Customizable axis ie we can define different labels to the axis
  • Save chart to SD-Card
  • Predefined color templates
  • Legends which are used to define which line depicts what.
  • Animations
  • Fully customizable, from background color to color of the lines and grids.

On trying MPAndroidChart, I found it to be a slightly difficult to implement.

Graph-View

Line Graph plotted using GraphView Library (image source)

It is also an open source graph view library by Jonas Gehring. The following are features of the Graph-View

  • Supports Line Chart, Bar Chart and Points.
  • Scrolling vertical and horizontal
  • Scaling on both axes.
  • Realtime Graph support
  • Draw multiple series of data. Let the diagram show more that one series in a graph. You can set a color and a description for every series.
  • Legends (as discussed in MPAndroidChart)
  • Custom labels
  • Manual Y axis limits can be set.

SciChart

It is rich APIs for Axis Ranging, Label Formatting, Chart Modifiers (interaction) and Renderable Series. It is packed with features but unfortunately, it is not open sourced.

The Verdict

Both MPAndroidChart and Graph-View are good libraries, packed with a lot of features. GraphView is easier to implement as compared to MPAndroidChat (not that difficult either). Both of them have the features like pinch zoom. MPAndroidChart had the feature of scale adjustment even when the graph is being plotted. The rate of plotting was comparable in both but it was slightly faster in MPAndroidChart. So, finally GraphView is easier to implement but MPAndroidChart has slightly better performance. So, we integrated MPAndroidChart in PSLab Android application.

Integrating MPAndroidChart in PSLab Android App

In order to integrate MPAndroidChart in the Android project add the following code in the build.gradle of your project.


compile 'com.github.PhilJay:MPAndroidChart:v3.0.1'

Creating Oscilloscope like graph

If we observe an Oscilloscope, it has a black/blue screen with grid lines. An oscilloscope is a voltage vs time graph hence the x axis represents the time elapsed and y axis the voltage of the signal at the instant of time. There are left and right y axis for different channels.

An Oscilloscope

In order to implement a graph similar to that of Oscilloscope in PSLab Android App using MPAndroidChart library, the graph needed to be customized.

The following step was taken to customized the graph in Oscilloscope Activity.

Background Color

mChart.setBackgroundColor(Color.BLACK);

This sets the background color of the graph as black. mChart is an object of the Line graph.

Legend

Legend l = mChart.getLegend();
l.setForm(Legend.LegendForm.LINE);
l.setTextColor(Color.WHITE);

Here we are setting the Legend form. There are many options available for the same like SQUARE, CIRCLE, and LINE. We are using LINE Legend form.  Also, we set the white color for the legend text.

X Axis Customization

x = mChart.getXAxis();
x.setTextColor(Color.WHITE);

First, we create an object of XAxis and set the textcolor as white.

x.setDrawGridLines(true);

The above method draws the grid lines along the x axis.

x.setAxisMinimum(0f);
x.setAxisMaximum(875f);

Now we will set the range of x axis by setting minimum value as 0 and the maximum value is 875.

Y Axis  Customization

y1 = mChart.getAxisLeft();
y1.setTextColor(Color.WHITE);
y1.setAxisMaximum(16f);
y1.setAxisMinimum(-16f);
y1.setDrawGridLines(true);

This is similar to what we did in x axis formatting.

After performing the above steps we got the following results.

To follow the entire code for graph customization refer chartinit method in Oscilloscope Activity, PSLab Android repository.

Resources

Continue ReadingComparing Different Graph View Libraries and Integrating Them in PSLab Android Application

Generating Real-Time Graphs in PSLab Android App

In PSLab Android App, we need to log data from the sensors and correspondingly generate real-time graphs. Real-time graphs mean a data streaming chart that automatically updates itself after every n second. This was different from what we did in Oscilloscope’s graph, here we need to determine the relative time at which the data is recorded from the sensor by the PSLab.

Another thing we need to take care of was the range of x axis. Since the data to be streamed is ever growing, setting a large range of the x axis will only make reading sensor data tedious for the user. For this, the solution was to make real time rolling window graph. It’s like when the graph exceeds the maximum range of x axis, the graph doesn’t show the initial plots. For example, if I set that graph should show the data only for the 10-second window when the 11th-second data would be plot, the 1st-second data won’t be shown by the graph and maintains the difference between the maximum and the minimum range of the graph. The graph library we are going to use is MPAndroidChart. Let’s break-down the implementation step by step.

First, we create a long variable, startTime which records the time at which the entire process starts. This would be the reference time. Flags make sure when to reset this time.

if (flag == 0) {
   startTime = System.currentTimeMillis();
   flag = 1;
}


We used Async Tasks approach in which the data is from the sensors is acquired in the background thread and the graph is updated in the UI thread. Here we consider an example of the HMC5883L sensor, which is actually Magnetometer. We are calculating time elapsed by subtracting current time with the sartTime and the result is taken as the x coordinate.

private class SensorDataFetch extends AsyncTask<Void, Void, Void> {
   ArrayList<Double> dataHMC5883L = new ArrayList<Double>();
   long timeElapsed;

   @Override
   protected Void doInBackground(Void... params) {
       
     timeElapsed = (System.currentTimeMillis() - startTime) / 1000;

     entriesbx.add(new Entry((float) timeElapsed, dataHMC5883L.get(0).floatValue()));
     entriesby.add(new Entry((float) timeElapsed, dataHMC5883L.get(1).floatValue()));
     entriesbz.add(new Entry((float) timeElapsed, dataHMC5883L.get(2).floatValue()));
       
     return null;
   }


As we need to create a rolling window graph we require to add few lines of code with the standard implementation of the graph using MPAndroidChart. This entire code is placed under onPostExecute method of AsyncTasks. The following code sets data set for the Line Chart and tells the Line Chart that a new data is acquired. It’s very important to call notifyDataSetChanged, without this the things won’t work.

mChart.setData(data);
mChart.notifyDataSetChanged();


Now, we will set the visible range of x axis. This means that the graph window of the graph won’t change until and unless the range set by this method is not achieved. Here we are setting it to be 10 as we need a 10-second window.

mChart.setVisibleXRangeMaximum(10);

Then we will call moveViewToX method to move the view to the latest entry of the graph. Here, we have passed data.getEntryCount method which returns the no. of data points in the data set.

mChart.moveViewToX(data.getEntryCount());


We will get following results

To see the entire code visit this link.

Resources

Continue ReadingGenerating Real-Time Graphs in PSLab Android App

Creating a Four Quadrant Graph for PSLab Android App

While working on Oscilloscope in PSLab Android, we had to implement XY mode. XY plotting is part of regular Oscilloscope and in XY plotting the 2 signals are plotted against each other. For XY plotting we require a graph with all 4 quadrants but none of the Graph-View libraries in Android support a 4 quadrants graph. We need to find a solution for this. So, we used canvas class to draw a 4 quadrants graph.  The Canvas class defines methods for drawing text, lines, bitmaps, and many other graphics primitives. Let’s discuss how a 4 quadrants graph is implemented using Canvas.

Initially, a class Plot2D extending View is created along with a constructor in which context, values for X-Axis, Y-Axis.

public class Plot2D extends View {
public Plot2D(Context context, float[] xValues, float[] yValues, int axis) {
   super(context);
   this.xValues = xValues;
   this.yValues = yValues;
   this.axis = axis;
   vectorLength = xValues.length;
   paint = new Paint();
   getAxis(xValues, yValues);
}


So, now we need to convert a particular float value in a pixel. This is the most important part and for this, we create a function where we send the value of the pixels, the minimum and the maximum value of the axis and array of float values. We get an array of converted pixel values in return. p[i] = .1 * pixels + ((value[i] – min) / (max – min)) * .8 * pixels; is the way to transform an int value to a respective pixel value.

private int[] toPixel(float pixels, float min, float max, float[] value) {
   double[] p = new double[value.length];
   int[] pInt = new int[value.length];

   for (int i = 0; i < value.length; i++) {
       p[i] = .1 * pixels + ((value[i] - min) / (max - min)) * .8 * pixels;
       pInt[i] = (int) p[i];
   }
   return (pInt);
}


For constructing a graph we require to create the axis, add markings/labels and plot data in the graph. To achieve this we will override onDraw method. The parameter to onDraw() is a Canvas object that the view can use to draw itself. First, we need to get various parameters like data to plot, canvas height and width, the location of the x axis and y axis etc.

@Override
protected void onDraw(Canvas canvas) {

   float canvasHeight = getHeight();
   float canvasWidth = getWidth();
   int[] xValuesInPixels = toPixel(canvasWidth, minX, maxX, xValues);
   int[] yValuesInPixels = toPixel(canvasHeight, minY, maxY, yValues);
   int locxAxisInPixels = toPixelInt(canvasHeight, minY, maxY, locxAxis);
   int locyAxisInPixels = toPixelInt(canvasWidth, minX, maxX, locyAxis);


Drawing the axis

First, we will draw the axis and for this, we will use the white color. To draw the white color axis line we will the following code.

paint.setColor(Color.WHITE);
paint.setStrokeWidth(5f);
canvas.drawLine(0, canvasHeight - locxAxisInPixels, canvasWidth,
       canvasHeight - locxAxisInPixels, paint);
canvas.drawLine(locyAxisInPixels, 0, locyAxisInPixels, canvasHeight,
       paint);


Adding the labels

After drawing the axis lines, now we need to mark labels for both x and y axis. For this, we use the following code in onDraw method. By this, the axis labels are automatically marked after a fixed distance. The no. of labels depends on the value of n. The code ensures that the markings are apt for each of the quadrant, for example in the first quadrant the markings of the x axis is below the axis, whereas markings of the y axis are to the left.

float temp = 0.0f;
int n = 8;
for (int i = 1; i <= n; i++) {
    if (i <= n / 2) {
           temp = Math.round(10 * (minX + (i - 1) * (maxX - minX) / n)) / 10;
           canvas.drawText("" + temp,
                   (float) toPixelInt(canvasWidth, minX, maxX, temp),
                   canvasHeight - locxAxisInPixels - 10, paint);
           temp = Math.round(10 * (minY + (i - 1) * (maxY - minY) / n)) / 10;
           canvas.drawText("" + temp, locyAxisInPixels + 10, canvasHeight
                           - (float) toPixelInt(canvasHeight, minY, maxY, temp),
                   paint);
       } else {
           temp = Math.round(10 * (minX + (i - 1) * (maxX - minX) / n)) / 10;
           canvas.drawText("" + temp,
                   (float) toPixelInt(canvasWidth, minX, maxX, temp),
                   canvasHeight - locxAxisInPixels + 30, paint);
           temp = Math.round(10 * (minY + (i - 1) * (maxY - minY) / n)) / 10;
           canvas.drawText("" + temp, locyAxisInPixels - 65, canvasHeight
                           - (float) toPixelInt(canvasHeight, minY, maxY, temp),
                   paint);

By using this code we get the following results

Plotting the data

The last step is to plot the data, to achieve this we first convert float values of x axis and y axis data point to pixels using toPixel method and simply draw it on the graph. In addition to this, we set a red color to the line.

paint.setStrokeWidth(2);
canvas.drawARGB(255, 0, 0, 0);
for (int i = 0; i < vectorLength - 1; i++) {
   paint.setColor(Color.RED);
   canvas.drawLine(xValuesInPixels[i], canvasHeight
           - yValuesInPixels[i], xValuesInPixels[i + 1], canvasHeight
           - yValuesInPixels[i + 1], paint);
}


This implements a 4 quadrants graph in PSLab Android app for XY plotting in Oscilloscope Activity. The entire code for the same is available in here.

Resources

  1. A simple 2D Plot class for Android
  2. Android.com reference of Custom Drawing

Continue ReadingCreating a Four Quadrant Graph for PSLab Android App